7.4. 축에 설명 붙이기
각 축에 설명을 위한 라벨을 붙여보자. 축에 라벨을 표시하기 위한 명령은
gnuplot> set xlab(el) "label" gnuplot> set ylab(el) "label" gnuplot> set zlab(el) "label" |
이 label에 지정된 문자가 축의 라벨로 표시된다. 라벨의 표시위치는 2차원의 경우 x축의 중앙과 y축의 좌측 위에, 3차원에서는 x축의 중앙, y축의 중앙, z축의 상부가 된다. 제목과 같이 "label" 뒤에
gnuplot> set xlab(el) "label" x,y
x,y에 수치를 넣어 오른쪽으로 x, 위쪽으로 y만큼 이동한다.
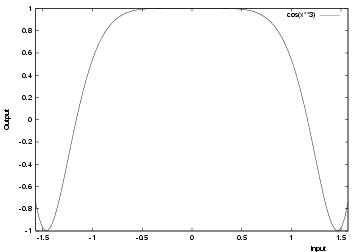
gnuplot> set xlab "Input" 30 gnuplot> set ylab "Output" gnuplot> plot [-pi/2:pi/2]cos(x**3) |
라벨을 표시하지 않기 위해서는
gnuplot> set xlabel
이라고 한다.